Time is our most valuable resource. Understanding the source, logic, and outcome of every query in your business is crucial for managing analytics costs, accuracy, and consistency. Without automation, this process can lead to outdated analytics, duplicate data pipelines, misaligned dashboards, and eroded trust among decision-makers.
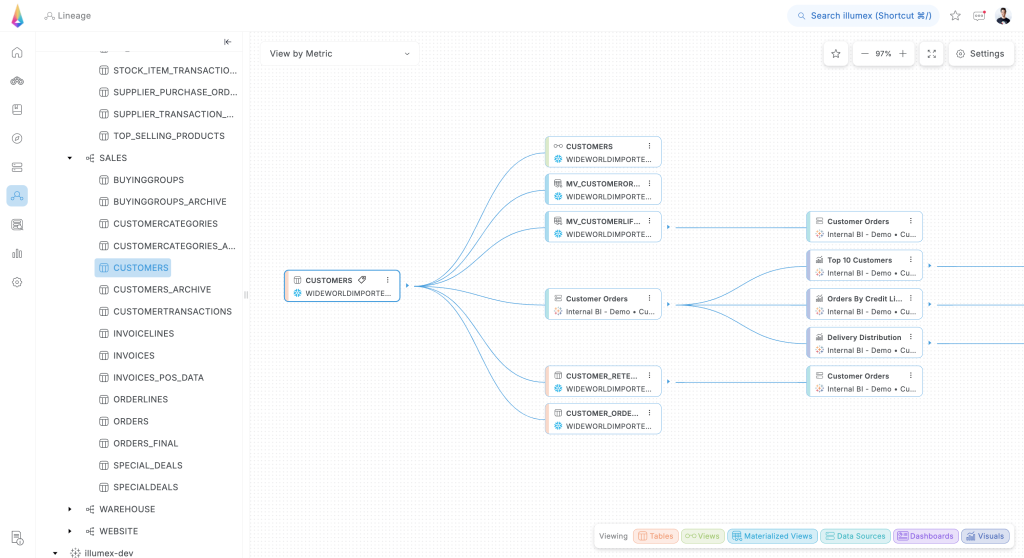
illumex addresses this challenge with its advanced Column-to-Metric Data Lineage feature. Automatically generated from your metadata, this feature provides comprehensive visibility into the journey of your data, enabling powerful root cause and impact analysis.
You can effortlessly track the origins and transformations of data elements up to analytics across your entire data ecosystem. By understanding the complete lineage and logic applied to tables, columns, and even BI components, you can easily pinpoint the root causes of issues or discrepancies, saving valuable time and effort in troubleshooting.
Furthermore, performing impact analysis allows you to assess the potential consequences of modifying a specific data element on other tables, views, reports, BI dashboards, and even particular visuals. By comprehending how changes to one table or column can impact your entire system, you can make informed decisions and mitigate any unintended effects, ensuring the integrity and reliability of your data and analytics.
illumex lineage also provides visibility to the data sources assembling a calculation of a business metric formula, and where this metric is taking place in its downstream data and analytics entities.
Accessing Column-to-Metric Lineage
The Lineage view can be accessed via:
- The left menu bar.
- Links from a specific data or analytics entity page.
- A single metric page.
- From the Starred menu.
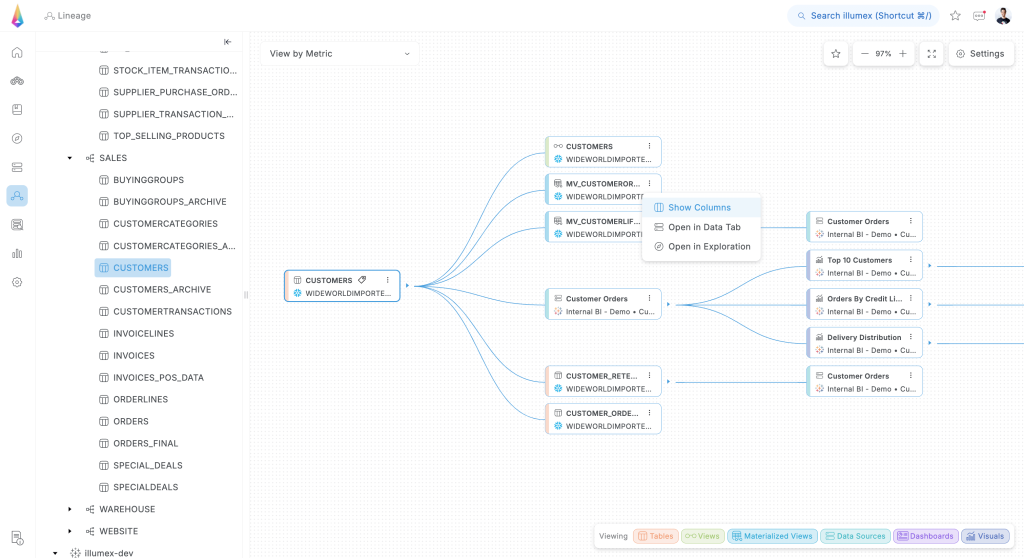
Lineage Entity Menu
For each entity, you can view its list of columns and dive deeper into column-level lineage where applicable. You can also jump to Visual Data Exploration and see your data landscape in a beautiful graph, with connections between the different entities based on the team’s practices and usage. You can also easily switch to Data Dictionary to inspect the usage context of each data object.
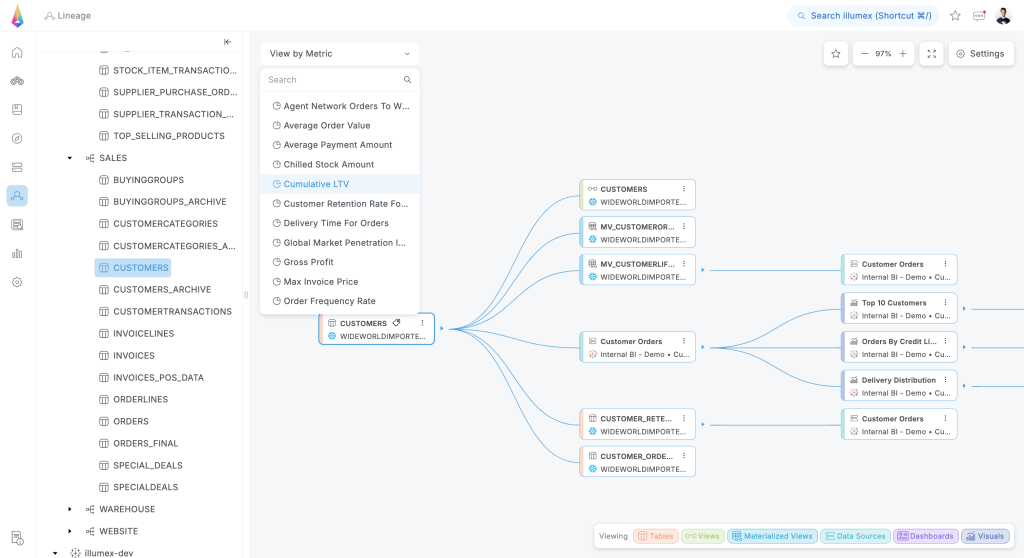
The legend at the bottom can assist you with identifying the type of entity you are looking at.
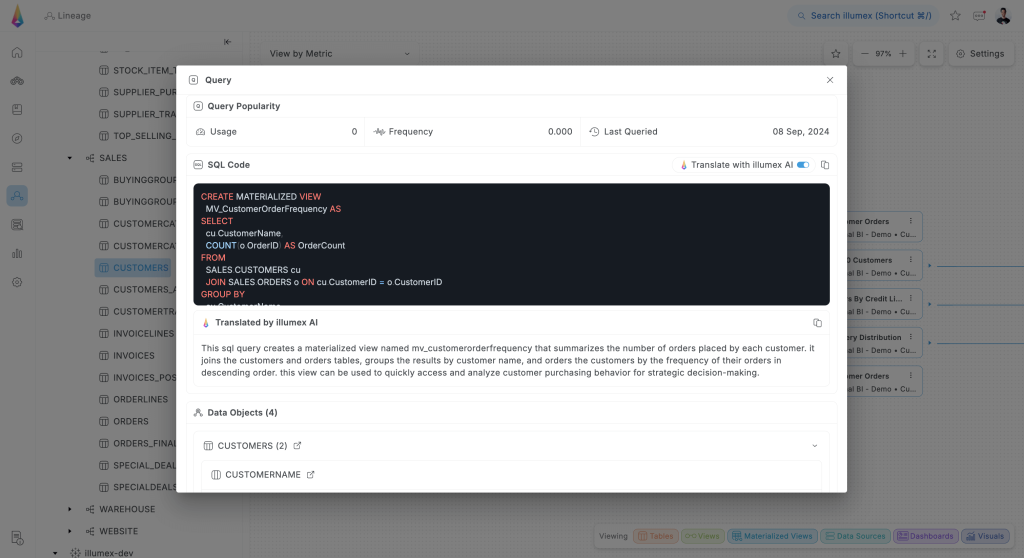
Transformation Info
You can also click on a connection between two data entities and review the transformation that took place there, where a natural language translation to the transformation code is available with a click of a button to distill the logic more concisely and clearly, even for transformation queries that include hundreds of lines of code and could be challenging to comprehend.
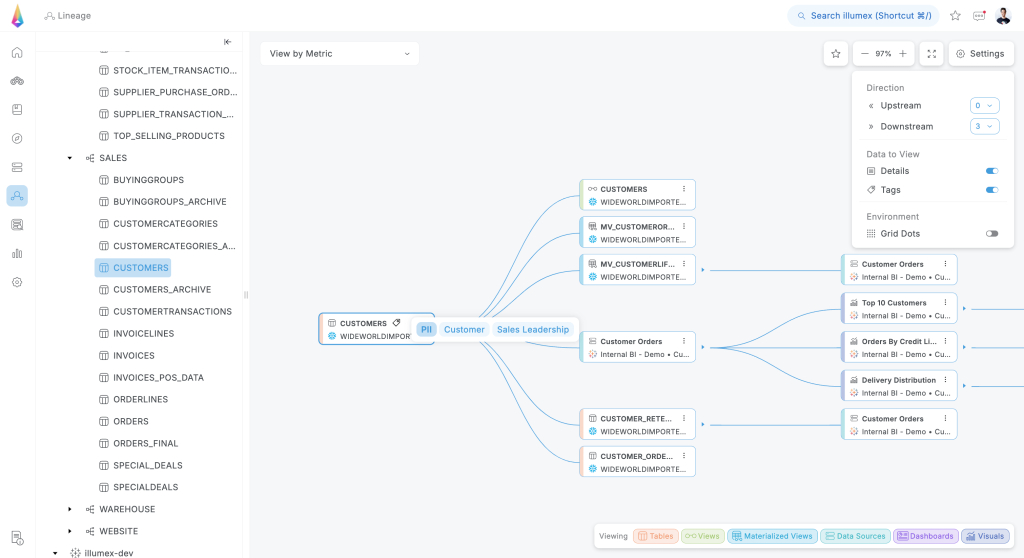
Customizing Your Lineage View
The Settings menu at the top-right corner helps you to set up the Lineage view’s look and feel, with the option to determine the level of upstream and downstream entities to present, show/hide entities’ details and tags, and either having a dotted or solid background.
Metric Lineage
In addition to the data and analytics lineage, illumex provides lineage even to a semantic metric – as metrics in illumex are defined from the business aspect, math aspect, and data aspect, by selecting a metric from the drop list menu at the top left corner of the lineage screen you can find on which data entities the metric was defined, what are its sources, and what downstream entities are using it.
Unleash the power of column-level data lineage and metric lineage, gain deep insights, uncover root causes, and make confident, well-informed decisions with minimal risk.
