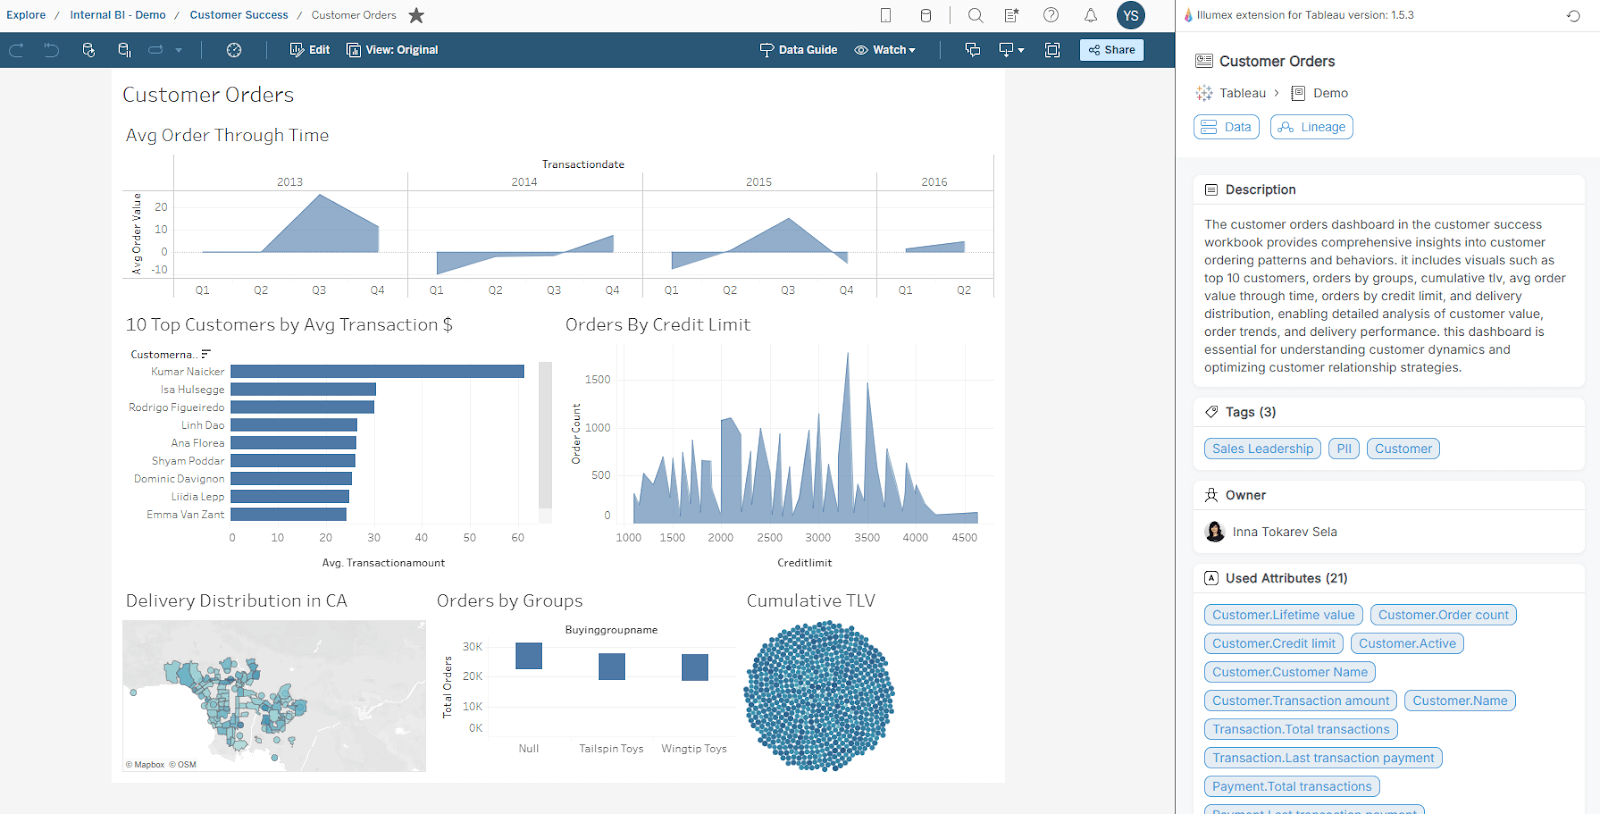
The Illumex Chrome Extension brings the power of illumex’s semantic fabric directly into your BI tools, providing contextual, dynamic, and actionable insights alongside your existing dashboards and reports.
Whether you’re working in Tableau, Power BI, or any other supported major BI tools, this extension enhances your analytical workflow by seamlessly embedding semantic metadata, lineage, and definitions without requiring you to leave your current environment.
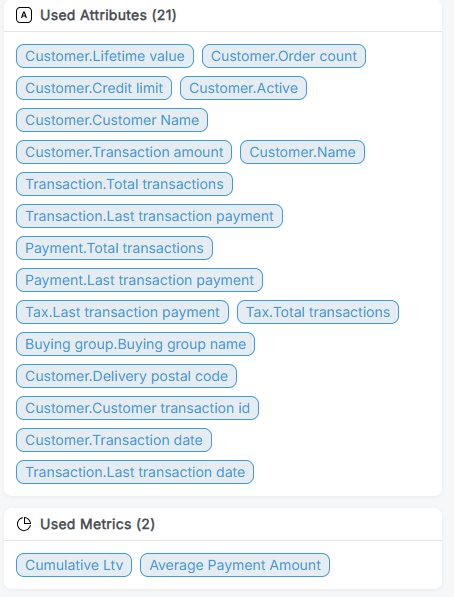
The illumex Chrome Extension is a dynamic feature designed to integrate seamlessly with BI tools, offering a rich blend of semantic insights directly from illumex. This integration allows BI users to continue their data analysis within the familiar BI tools interface while simultaneously accessing valuable insights about the data. It infuses the dashboard with enriched semantic insights, including metrics and business terms’ attributes, complete with their definitions and usage data.
This extension ensures that users can deepen their understanding of data without leaving their workflow in the BI application, thus saving time and increasing trust in the data they work with. The design eliminates the need for additional training or onboarding, allowing for a smooth and unobtrusive integration into existing processes.
1. Contextual Awareness
The illumex extension is fully context-sensitive and adapts its content based on where you are in your BI tool:
- At the dashboard level: see high-level metadata, tags, and related business metrics for the full report.
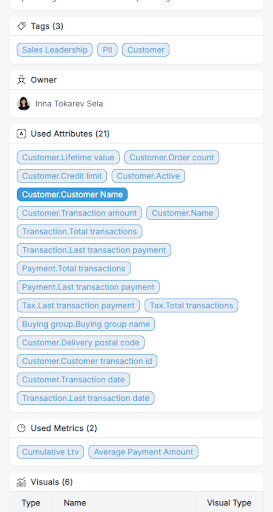
- At the visual level: drill down into the specific chart or KPI to view the semantic elements that power it.
- During interaction (e.g., click, hover, drill-through): the extension updates automatically to reflect the current focus area in your BI application.
This ensures you’re always presented with relevant information without the need for manual navigation.
2. Dynamic Updates in BI Tool’s Edit Mode
While editing dashboards or reports, the extension continuously synchronizes with your actions:
- Drag-and-drop fields into a visual? The extension will update in real-time with the associated semantic definitions and calculated fields.
- Add new visuals or KPIs? You’ll instantly see the related metadata and understand how it ties back to the semantic layer.
- Modify filters or groups? Watch the semantic mapping evolve as you design.
This dynamic behavior supports iterative, real-time exploration while maintaining clarity and consistency with your data model.
3. Easy Access to illumex Metadata
Each BI element (dashboard, visual, field, metric) is linked directly to its semantic representation in the illumex platform.
From the Chrome Extension, users can instantly:
- View descriptions, tags, and ownership information.
- See semantic term and metric associations such as metrics, KPIs, and dimensions.
- Click through to open the corresponding page on the illumex platform for deeper analysis or lineage exploration.
This enables quick metadata lookups, promotes data stewardship, and reduces knowledge silos between teams.
4. Full Column-Level Lineage
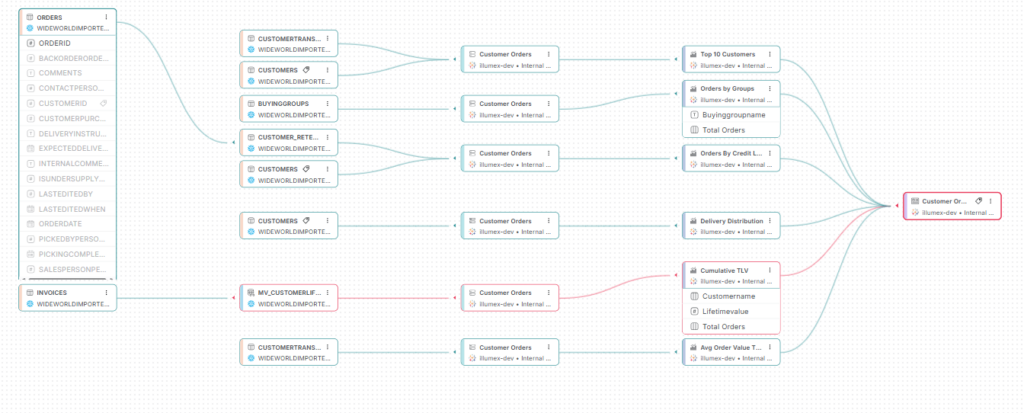
Visualize how data flows across your ecosystem — from source tables to calculated metrics in your BI dashboards.
With the Chrome Extension, users can:
- View lineage from upstream sources (e.g., Snowflake tables) all the way to downstream BI visuals.
- Expand lineage paths to reveal specific columns and SQL transformation logic.
- Understand data dependencies, validate calculations, and troubleshoot inconsistencies — all within a few clicks.
This end-to-end visibility promotes trust and helps users confidently answer questions like: “Where is this number coming from?”
5. Calculated Field Transparency
BI tools often abstract complex field logic, making it hard to understand what a metric truly represents.
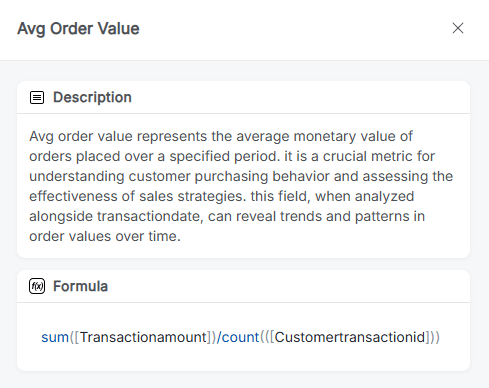
Illumex solves this by exposing calculated field formulas when available:
- Click on a visual or metric to reveal underlying expressions (e.g., IF [Sales] > 1000 THEN ‘High’ ELSE ‘Low’).
- See how fields are constructed from raw data and how they relate to semantic terms and attributes.
- Gain clarity on business rule implementations, even if the original BI tool doesn’t surface the logic.
This capability significantly improves auditability, understanding, and trust in your metrics.
This dual access point enhances understanding and contributes to a more informed and efficient data analysis experience inside of the BI application.
By bridging the gap between business context and technical data structures, it helps:
- Boost data literacy by making semantics accessible at every touchpoint.
- Eliminate BI context-switching, keeping users focused and informed.
- Strengthen collaboration between data, BI, and business teams.
- Ensure governance and trust, backed by transparency and traceability.
- Empower confident decision-making with always-available context.
